> ## Documentation Index
> Fetch the complete documentation index at: https://mintlify-poc.mintlify.site/llms.txt
> Use this file to discover all available pages before exploring further.
# Integrate Prometheus with Tiger Cloud
> Export telemetry metrics from your service to monitor system performance and health
export const SERVICE_SHORT = 'service';
export const SERVICE_LONG = 'Tiger Cloud service';
export const SELF_LONG = 'self-hosted TimescaleDB';
export const SCALE = 'Scale';
export const PRICING_PLAN = 'pricing plan';
export const ENTERPRISE = 'Enterprise';
export const CONSOLE = 'Tiger Console';
export const CLOUD_LONG = 'Tiger Cloud';
[Prometheus][prometheus] is an open-source monitoring system with a dimensional data model, flexible query language, and a modern alerting approach.
This page shows you how to export your {SERVICE_SHORT} telemetry to Prometheus:
* For {CLOUD_LONG}, using a dedicated Prometheus exporter in {CONSOLE}.
* For {SELF_LONG}, using [Postgres Exporter][postgresql-exporter].
## Prerequisites
To follow the steps on this page:
* [Download and run Prometheus][install-prometheus].
* For {CLOUD_LONG}:
Create a target [{SERVICE_LONG}][create-service] with Real-time analytics enabled.
* For {SELF_LONG}:
* Create a target [{SELF_LONG}][enable-timescaledb] instance. You need your [connection details][connection-info].
* [Install Postgres Exporter][install-exporter].
To reduce latency and potential data transfer costs, install Prometheus and Postgres Exporter on a machine in the same AWS region as your {SERVICE_LONG}.
## Export {SERVICE_LONG} telemetry to Prometheus
To export your data, do the following:
To export metrics from a {SERVICE_LONG}, you create a dedicated Prometheus exporter in {CONSOLE}, attach it to your {SERVICE_SHORT}, then configure Prometheus to scrape metrics using the exposed URL. The Prometheus exporter exposes the metrics related to the {SERVICE_LONG} like CPU, memory, and storage. To scrape other metrics, use Postgres Exporter as described for {SELF_LONG}. The Prometheus exporter is available for [{SCALE} and {ENTERPRISE}][pricing-plan-features] {PRICING_PLAN}s.
1. **Create a Prometheus exporter**
1. In [{CONSOLE}][open-console], click `Exporters` > `+ New exporter`.
2. Select `Metrics` for data type and `Prometheus` for provider.
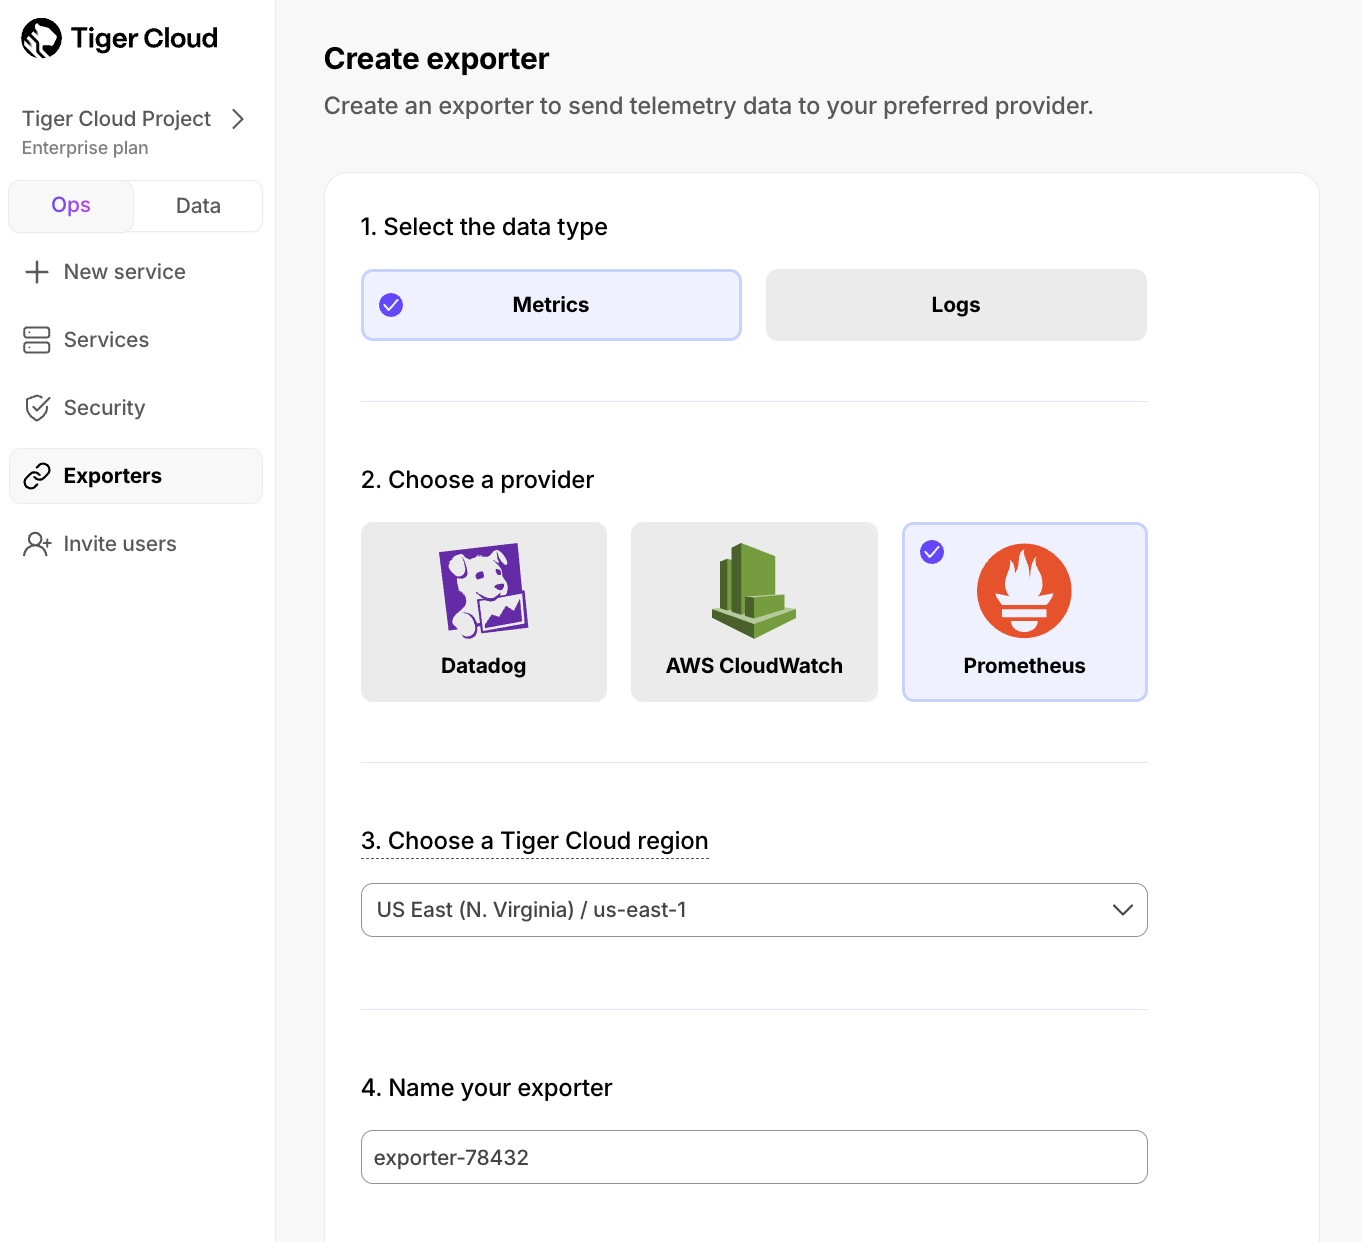
3. Choose the region for the exporter. Only {SERVICE_SHORT}s in the same project and region can be attached to this exporter.
4. Name your exporter.
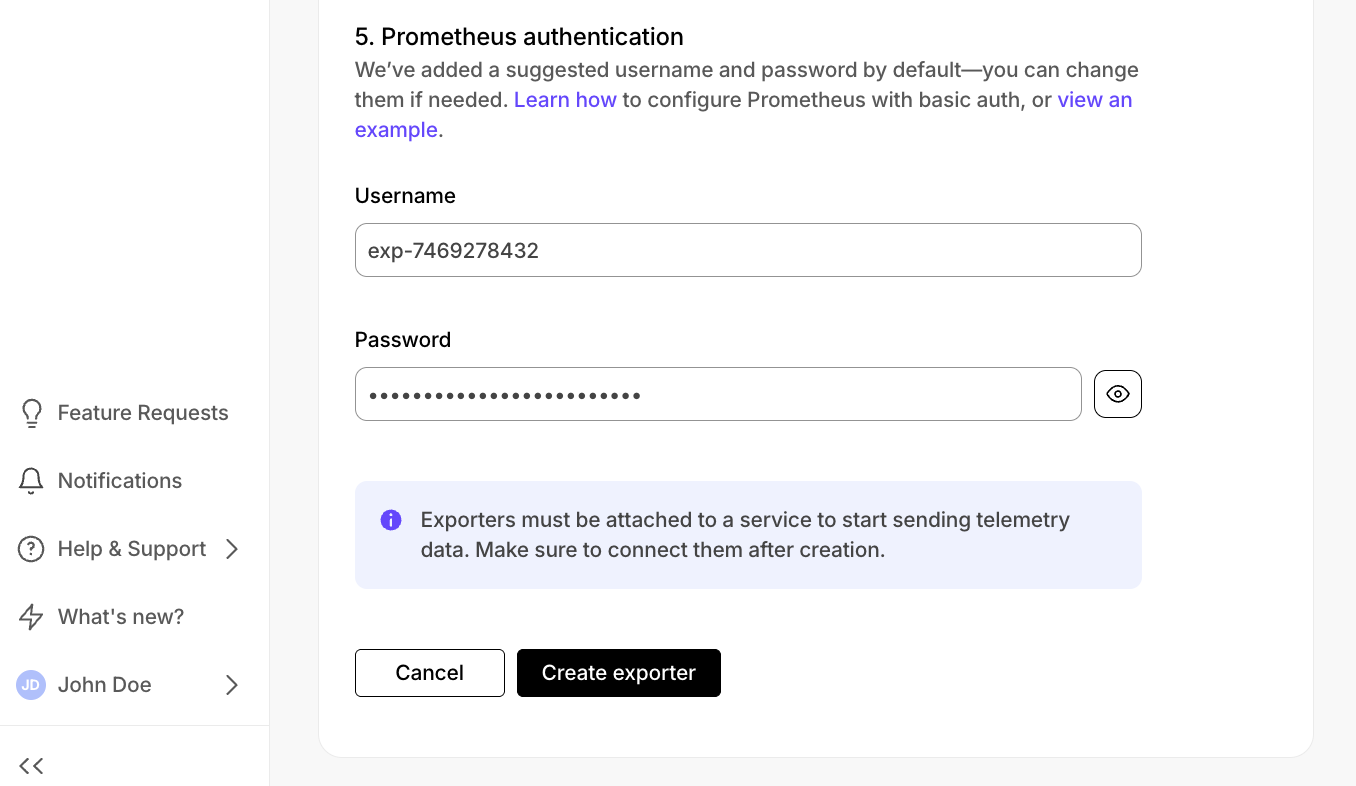
5. Change the auto-generated Prometheus credentials, if needed. See [official documentation][prometheus-authentication] on basic authentication in Prometheus.
2. **Attach the exporter to a {SERVICE_SHORT}**
1. Select a {SERVICE_SHORT}, then click `Operations` > `Exporters`.
2. Select the exporter in the drop-down, then click `Attach exporter`.
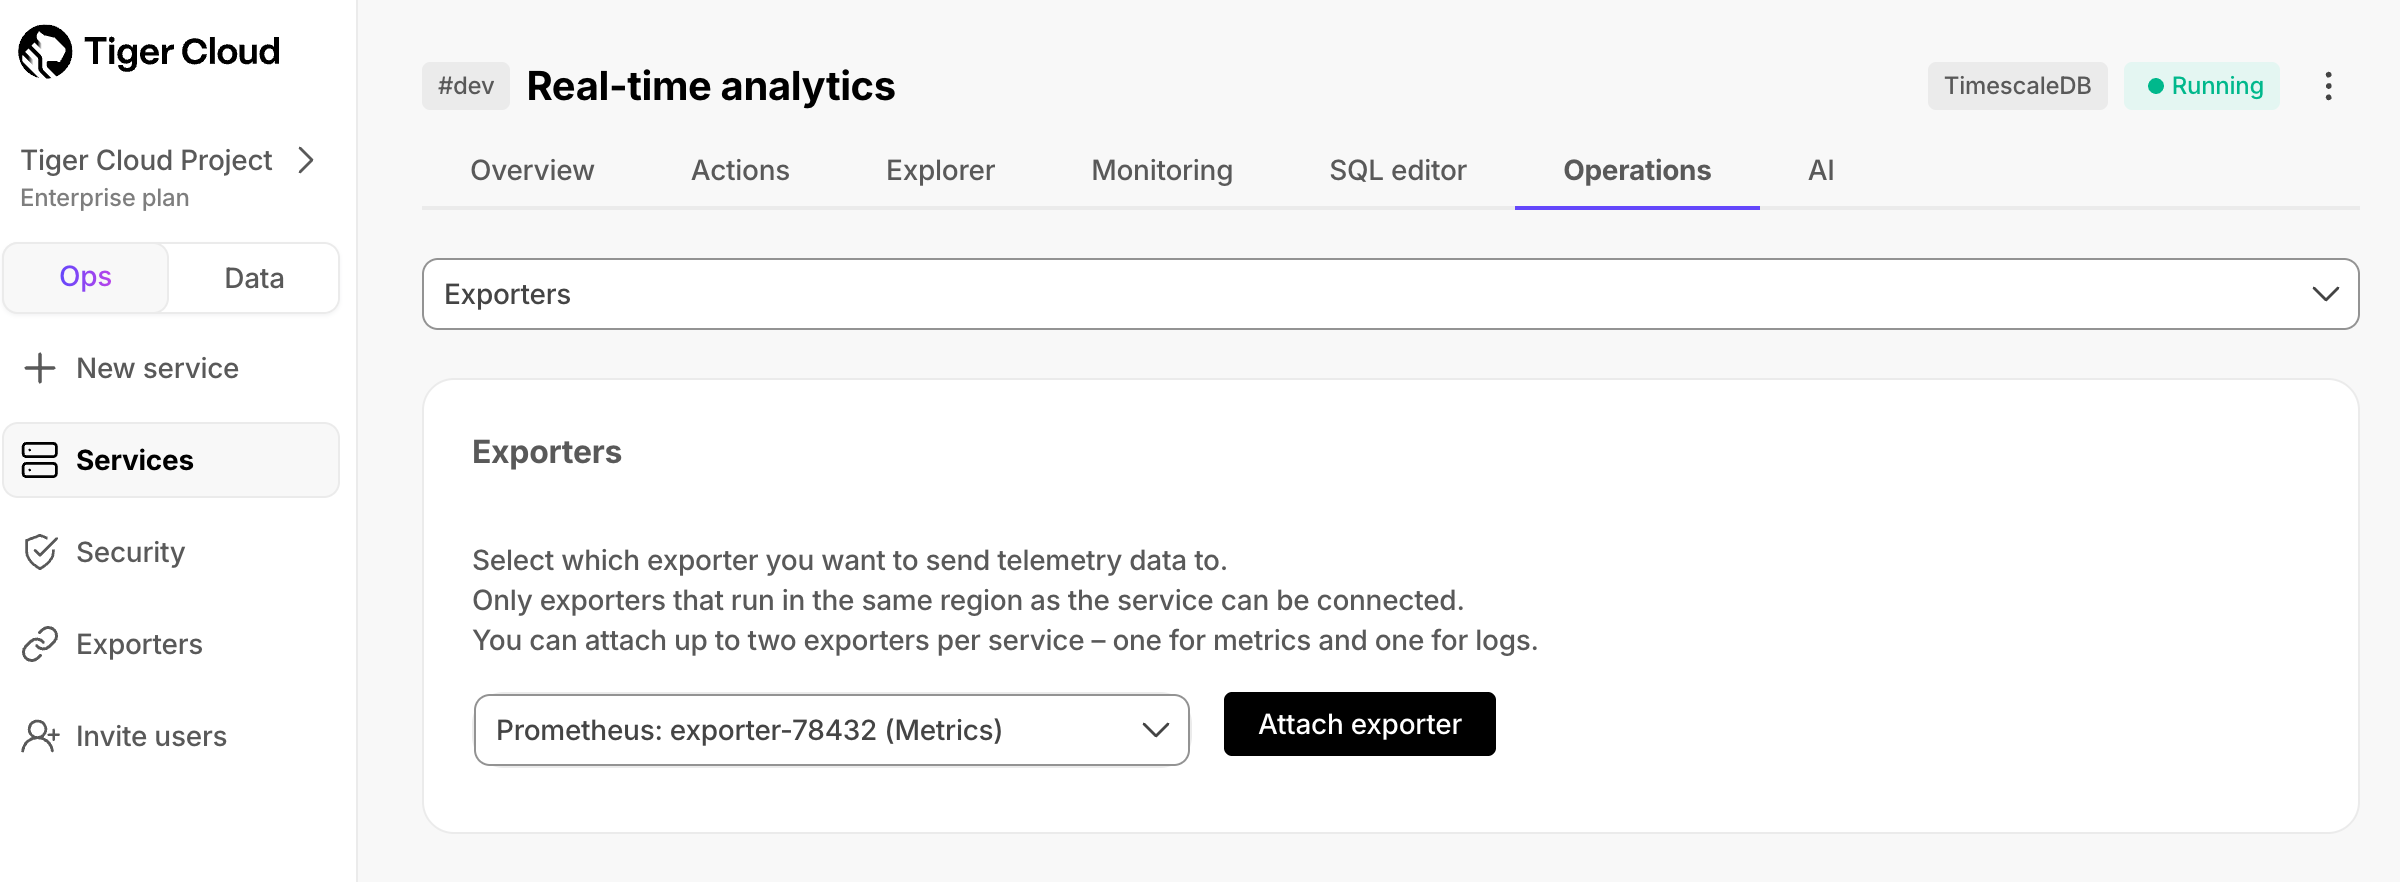
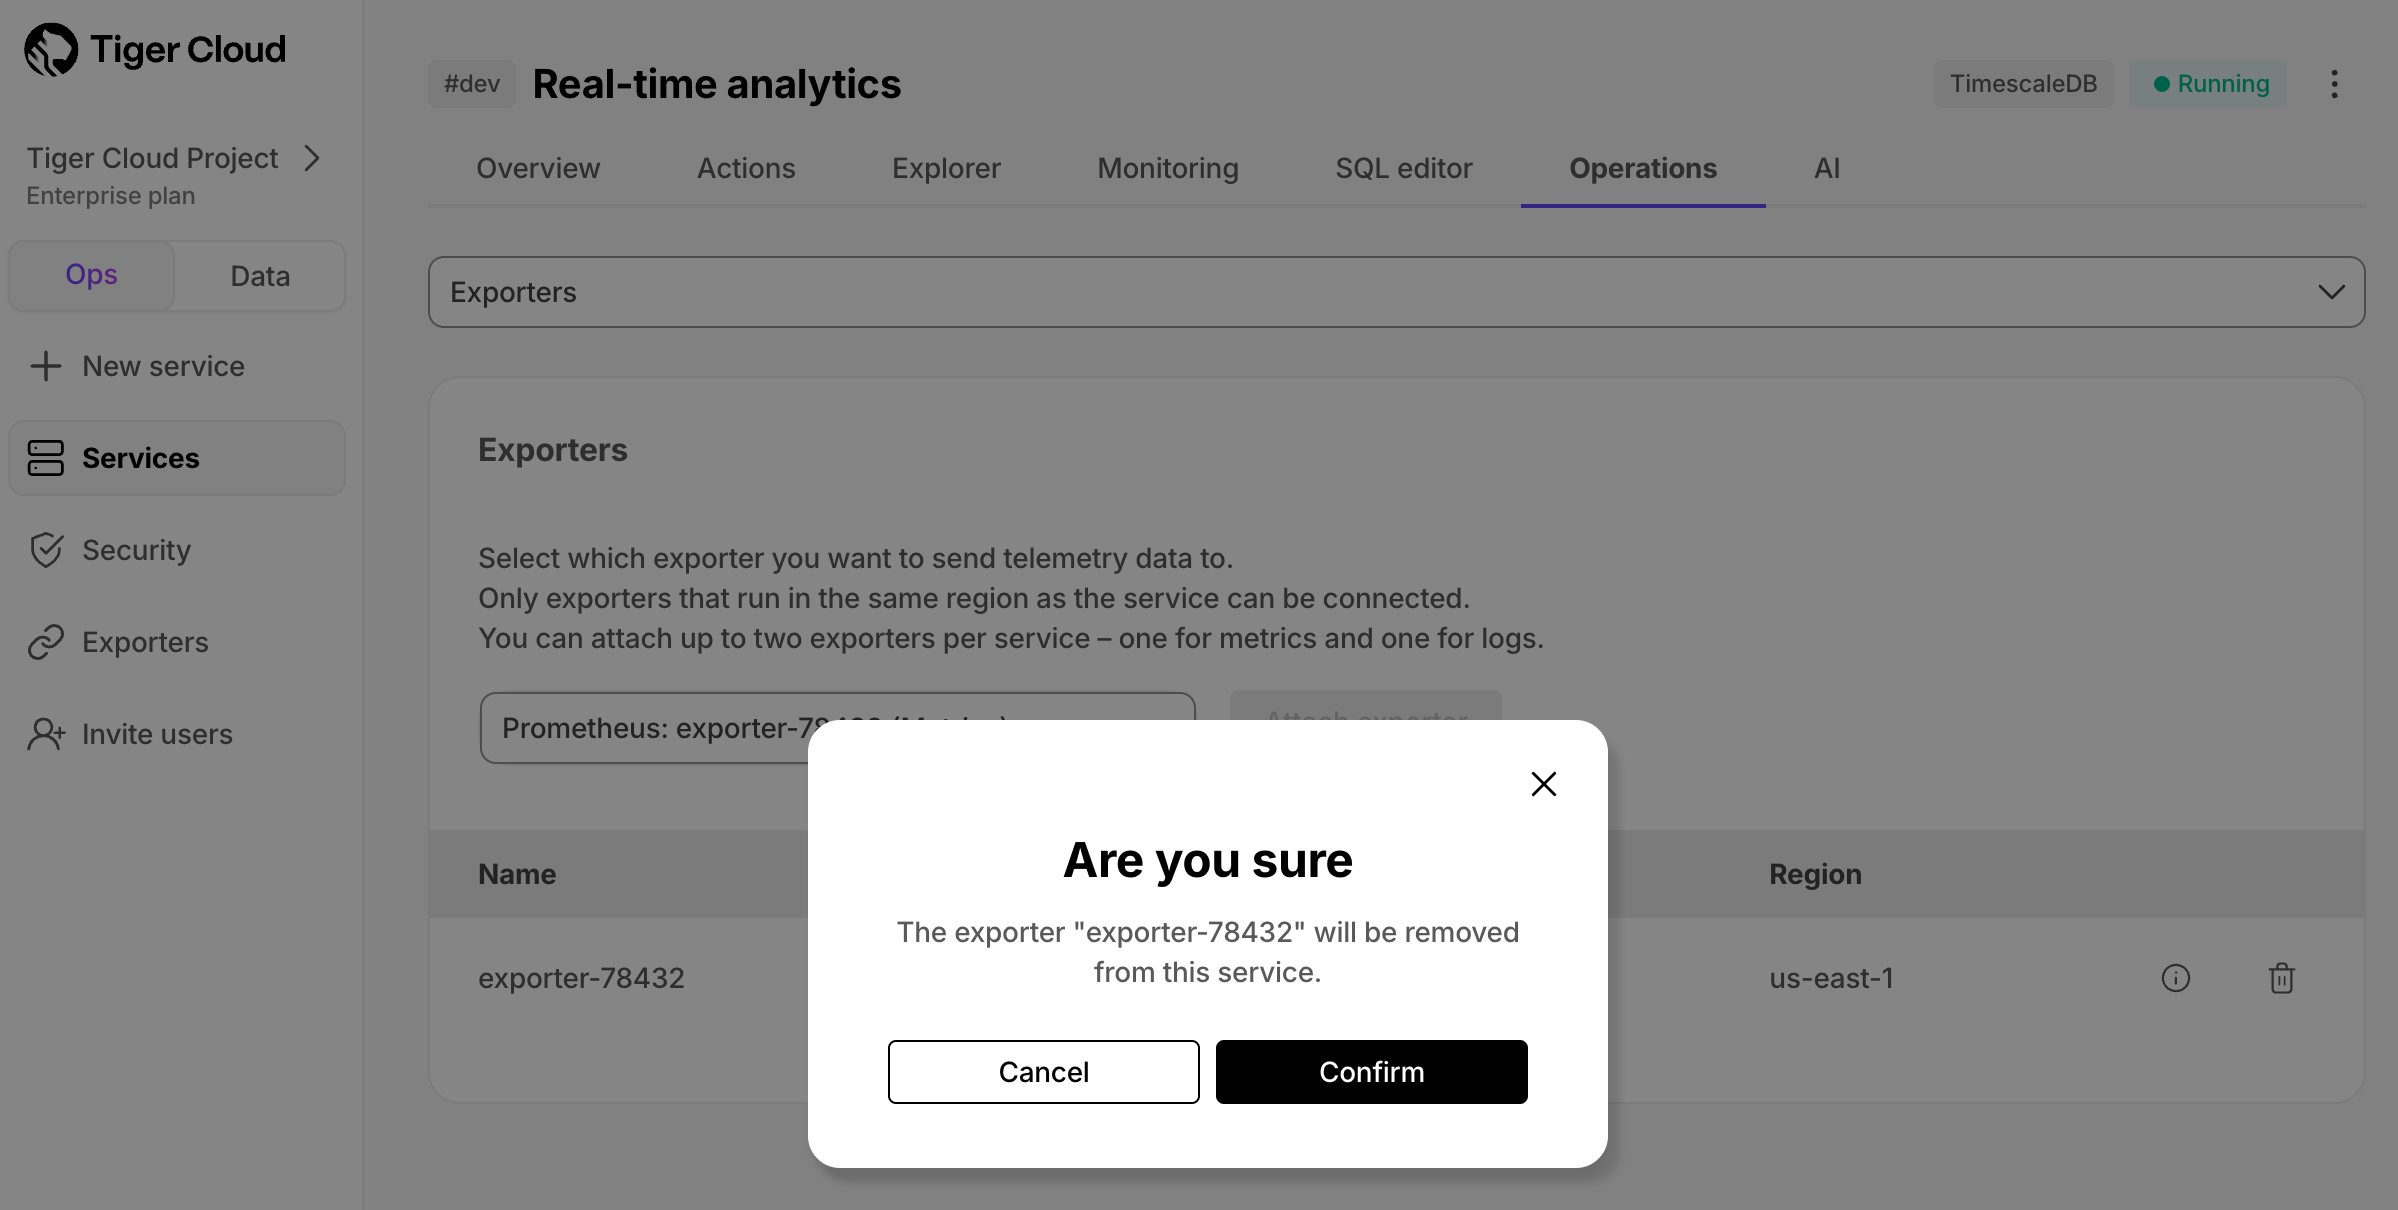
The exporter is now attached to your {SERVICE_SHORT}. To unattach it, click the trash icon in the exporter list.
3. **Configure the Prometheus scrape target**
1. Select your service, then click `Operations` > `Exporters` and click the information icon next to the exporter. You see the exporter details.
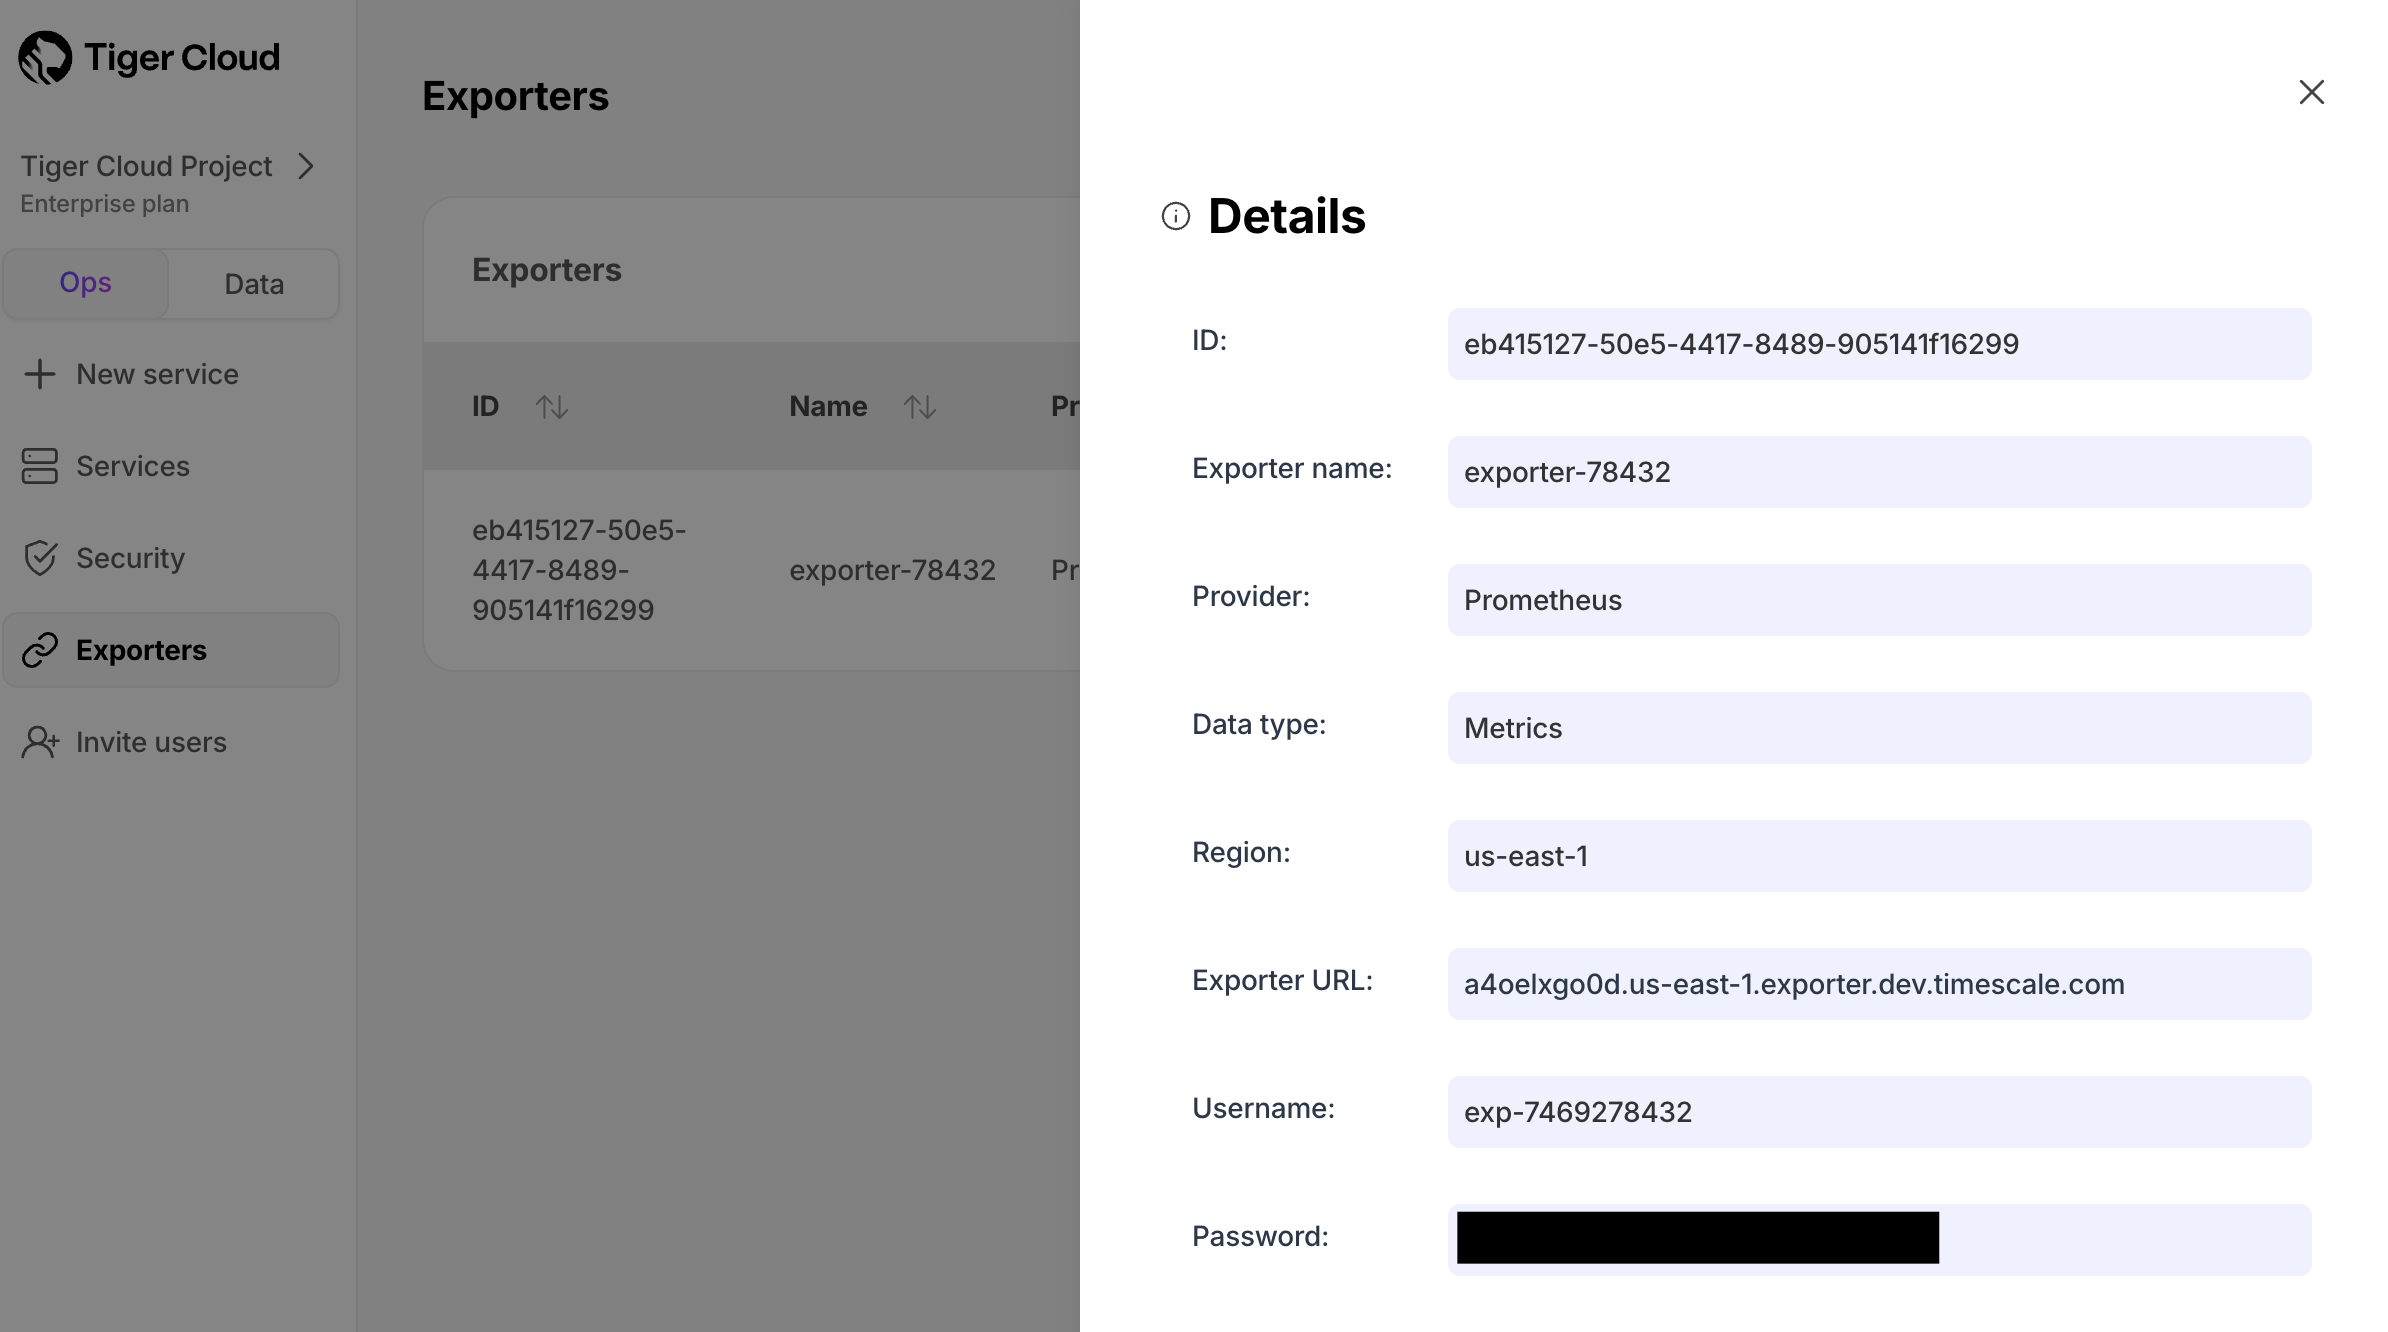
2. Copy the exporter URL.
3. In your Prometheus installation, update `prometheus.yml` to point to the exporter URL as a scrape target:
```yml theme={"dark"}
scrape_configs:
- job_name: "timescaledb-exporter"
scheme: https
static_configs:
- targets: ["my-exporter-url"]
basic_auth:
username: "user"
password: "pass"
```
See the [Prometheus documentation][scrape-targets] for details on configuring scrape targets.
You can now monitor your {SERVICE_SHORT} metrics. Use the following metrics to check the service is running correctly:
* `timescale.cloud.system.cpu.usage.millicores`
* `timescale.cloud.system.cpu.total.millicores`
* `timescale.cloud.system.memory.usage.bytes`
* `timescale.cloud.system.memory.total.bytes`
* `timescale.cloud.system.disk.usage.bytes`
* `timescale.cloud.system.disk.total.bytes`
Additionally, use the following tags to filter your results.
| Tag | Example variable | Description |
| ------------ | --------------------------- | --------------------------------- |
| `host` | `us-east-1.timescale.cloud` | |
| `project-id` | | |
| `service-id` | | |
| `region` | `us-east-1` | AWS region |
| `role` | `replica` or `primary` | For {SERVICE_SHORT} with replicas |
To export metrics from {SELF_LONG}, you import telemetry data about your database to Postgres Exporter, then configure Prometheus to scrape metrics from it. Postgres Exporter exposes metrics that you define, excluding the system metrics.
1. **Create a user to access telemetry data about your database**
1. Connect to your database in [`psql`][psql] using your [connection details][connection-info].
2. Create a user named `monitoring` with a secure password:
```sql theme={"dark"}
CREATE USER monitoring WITH PASSWORD '';
```
3. Grant the `pg_read_all_stats` permission to the `monitoring` user:
```sql theme={"dark"}
GRANT pg_read_all_stats to monitoring;
```
2. **Import telemetry data about your database to Postgres Exporter**
1. Connect Postgres Exporter to your database:
Use your [connection details][connection-info] to import telemetry data about your database. You connect as
the `monitoring` user:
* Local installation:
```shell theme={"dark"}
export DATA_SOURCE_NAME="postgres://:@:/?sslmode="
./postgres_exporter
```
* Docker:
```shell theme={"dark"}
docker run -d \
-e DATA_SOURCE_NAME="postgres://:@:/?sslmode=" \
-p 9187:9187 \
prometheuscommunity/postgres-exporter
```
2. Check the metrics for your database in the Prometheus format:
* Browser:
Navigate to `http://:9187/metrics`.
* Command line:
```shell theme={"dark"}
curl http://:9187/metrics
```
3. **Configure Prometheus to scrape metrics**
1. In your Prometheus installation, update `prometheus.yml` to point to your Postgres Exporter instance as a scrape
target. In the following example, you replace `` with the hostname or IP address of the PostgreSQL
Exporter.
```yaml theme={"dark"}
global:
scrape_interval: 15s
scrape_configs:
- job_name: 'postgresql'
static_configs:
- targets: [':9187']
```
If `prometheus.yml` has not been created during installation, create it manually. If you are using Docker, you can
find the IPAddress in `Inspect` > `Networks` for the container running Postgres Exporter.
2. Restart Prometheus.
3. Check the Prometheus UI at `http://:9090/targets` and `http://:9090/tsdb-status`.
You see the Postgres Exporter target and the metrics scraped from it.
You can further [visualize your data][grafana-prometheus] with Grafana. Use the
[Grafana Postgres dashboard][postgresql-exporter-dashboard] or [create a custom dashboard][grafana] that suits your needs.
[install-exporter]: https://grafana.com/oss/prometheus/exporters/postgres-exporter/?tab=installation
[postgresql-exporter-dashboard]: https://grafana.com/oss/prometheus/exporters/postgres-exporter/?tab=dashboards
[install-prometheus]: https://prometheus.io/docs/prometheus/latest/installation/
[grafana]: /integrations/grafana/
[grafana-prometheus]: https://grafana.com/docs/grafana-cloud/send-data/metrics/metrics-prometheus/
[prometheus]: https://prometheus.io/docs/introduction/overview/
[run-queries]: /deploy-and-operate/tiger-cloud/get-started/run-queries-from-console
[psql]: /integrations/psql/
[connection-info]: /integrations/find-connection-details/
[postgresql-exporter]: https://grafana.com/oss/prometheus/exporters/postgres-exporter/
[open-console]: https://console.cloud.timescale.com/dashboard/services
[create-service]: /deploy-and-operate/get-started/create-services
[enable-timescaledb]: /deploy-and-operate/self-hosted/install/
[prometheus-authentication]: https://prometheus.io/docs/guides/basic-auth/
[scrape-targets]: https://prometheus.io/docs/prometheus/latest/configuration/configuration/#scrape_config
[pricing-plan-features]: /about/pricing-and-account-management/#features-included-in-each-plan
This feature is currently not supported for {CLOUD_LONG} on Microsoft Azure.